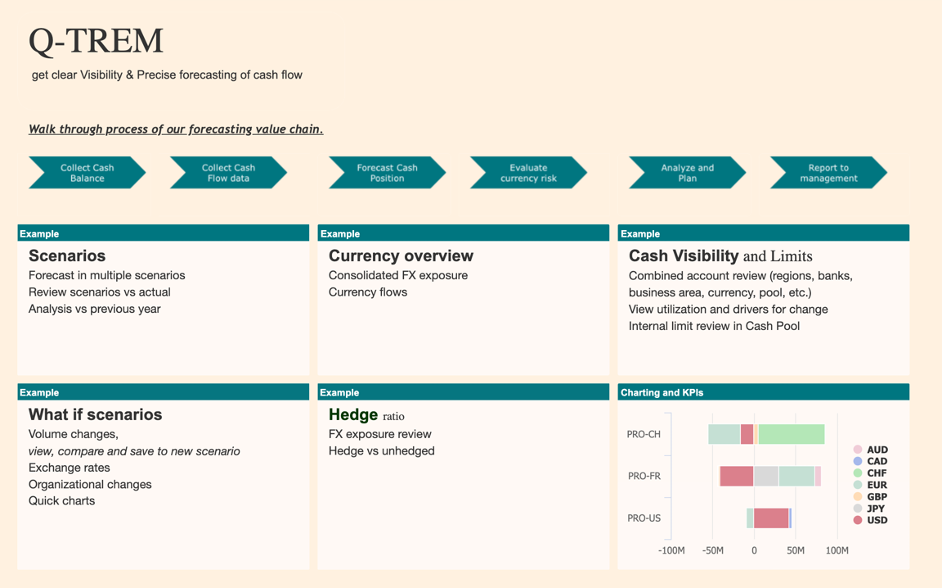
Experience Q-TREM.
The solution for Cash Visibility & Forecasting
Gain control of your cash flow and make the most informed decisions. Improve your financial health with Q-TREM.
Our innovative platform
combines cash visibility with frequent updates
and comparisons of cash forecasts.
What we provide
-
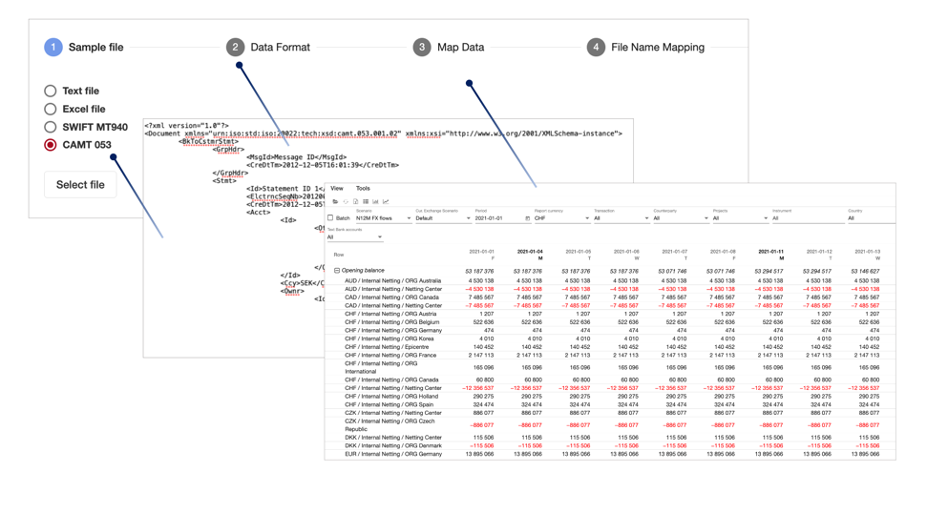
Connectivity
Automated upload of transactions. Self-Service wizard will guide you.
-
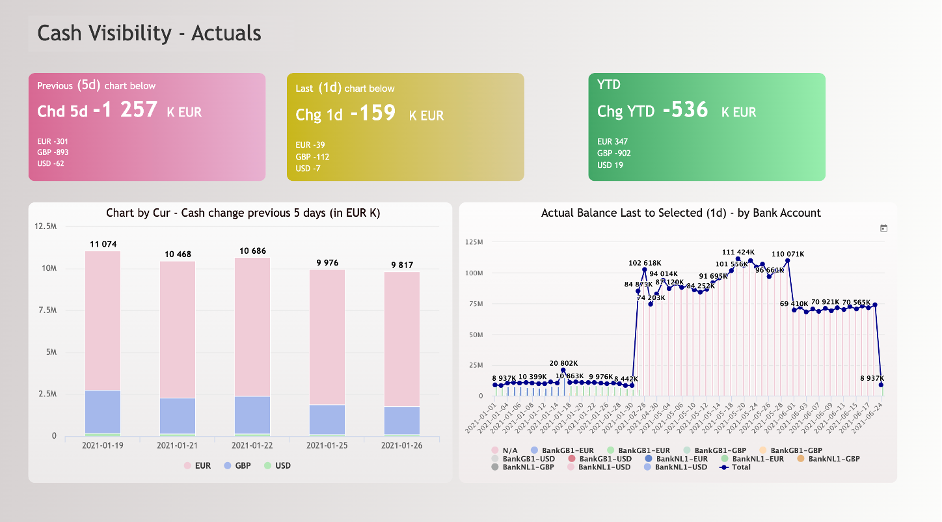
Cash Visibility
Know your drivers for change. Follow external bank balances, trapped cash as well as cash pools.
-
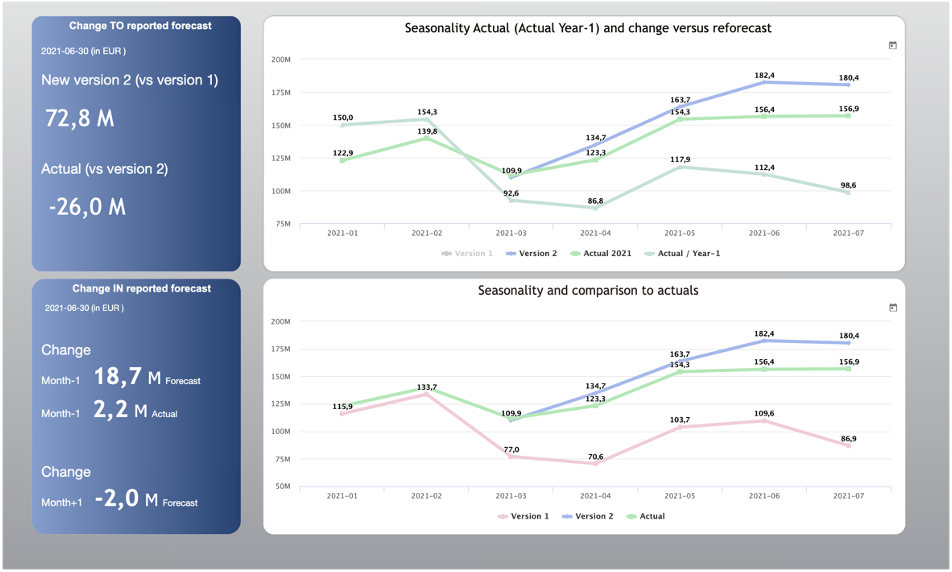
Forecasting
Run and compare multiple forecast scenarios to recommend best fit.
-
FX Reporting
Combine cash forecasting with foreign exchange risk reporting in one go.
-
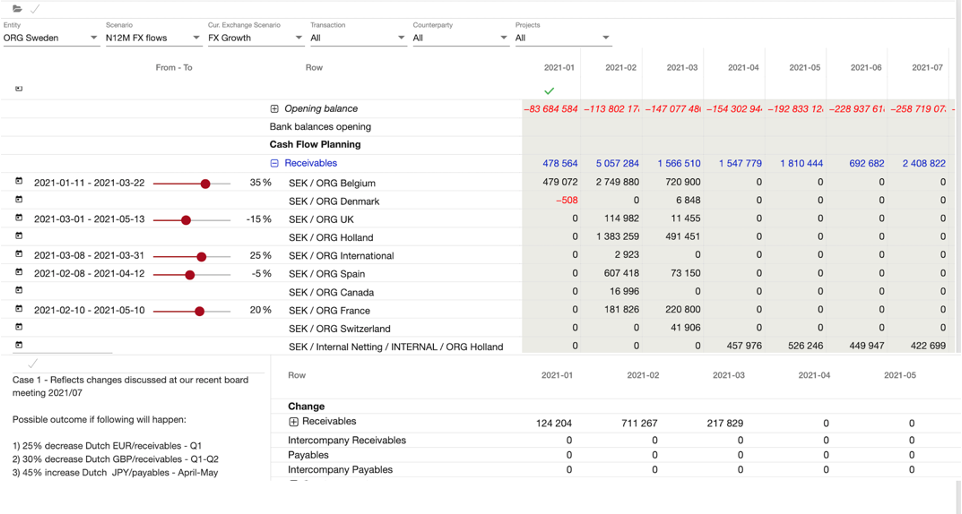
Scenario Modeling
See immediate effect of what-if modelling made to existing forecasts.
-
Dashboarding
Build and visualize your KPIs, multiple charts, graphs & drill downs.
Q-TREM provides a lean forecast process, clear and precise.

Key features
Connectivity
- Scheduling & automation
- Multiple templates for uploads
- Bank statements MT 940/942
- Bank statements CAMT 053/052
- Transactional data from TMS applications AR/AP – ERP transactions
- Currency exchange rates
- Loans / Deposits
- Audit trail with transactional log
- Error resolution with immediate feedback
- APIs / FTPs
Cash Visibility
- See drivers for change
- Where are my cash balances held
- Review change by bank, region, business unit, currency or cash pool
- Follow external bank balances, trapped cash
- Visualization of internal AR/AP in cash pools
- See limit utilization and non utilized credit facilities
- Transparently presented in charts & dashboards
Forecasting
- Update forecasts as frequently as desired
- Run & compare multiple forecasts
- Combine short & long term or mixed periods of forecast
- Tailor input layouts
- Create various forecast models
- Define alert messaging
- Forecast on preferred level, bank, currency, pool, project or any other transaction type
- Combine forecast with real FX exposure reporting
- Sequential planning (of intra-group flows) from/to counterparties
FX Reporting
- Advanced possibilities to consolidate & breakdown group-wide currency exposures
- Forecasting flows in original currency & bank account level, brings insight for risk management
- True consolidated group FX exposure analysis.
- Automatic pivot table for further insights on FX exposure
- Central- and local follow-up of hedge ratios.
Scenario Modeling
- All planning rows available for What-if analyses
- Use intuitive sliders for making a change
- Select period from-to reflecting the change
- Save your what-if case with commentary notes
- See immediately effect of currency modelling or any other changes made to existing forecasts.
- Make what-if modifications directly in your forecast report
Dashboarding
- Embedded self-service tool for building your dashboards
- Embedded meaning constant online access
- Build & design your own KPIs with multiple chart options or drill-down reports
- Dashboards available on devices by choice, laptops, tablets or mobile phones
- Design your own workflow process, enhancing user experience
Pricing
Professional
WHAT ́S INCLUDED
- Access to all features
- Rights to modify & create
- Secury settings
- Process settings
- User permissions
1) (One user required)
Planner
WHAT ́S INCLUDED
- Rights to modify & create
- Upload of data / auto scheduling
- Input / edit forecasts
- Dashboarding
- Scenario modeling
Viewer
WHAT ́S INCLUDED
- View rights only
- Forecasts
- Dashboards
- Scenario modeling
No. of Entities
(all prices excluding VAT & taxes)
Partners
Implementation
We have partnered with seasoned professionals who possess extensive knowledge of both our solution and the specific client process we cater to.
Join us, become a partner
Whether you are a Treasury consultant, ERP, TMS, FP&A vendor or a Bank, if you recognize the benefits of integrating our solution into your services for clients & prospects.
We invite you to become a strategic partner.
please contact us at info@q-trem.com

Partners
Treasury Management SA is a Swiss based Corporate Treasury Service provider to international business groups and organisations. As part of the services, they will implement and offer to manage your planning, cash visibility and exposure analysis using the latest Q-TREM solution.
Visit website
KPMG in Sweden has a lengthy and well- established track record in Cash Management & Liquidity Forecasting, making it the preferred choice for Q-TREM liquidity management implementation consulting.
Visit websiteAbout us
About Q-TREM
Q-TREM offers a true cloud cash forecasting solution for the treasurer & finance teams. We are an Estonian fintech company with offices in Sweden & Switzerland.
The challenge
Unlock success by conquering cash visibility challenges, FX volatility, exposures, and forecasting uncertainties. Year after year, surveys highlight these issues as top priorities. The question remains: Is it a lack of process, a solution, or a combination of both? Let us provide the answers and transform these challenges into opportunities for your success.
Who we are
Our team with many years of leading positions as tech entrepreneurs, CFO & Head of Treasury, combined with software development decided to do something about the challenge.
Call us |
Email us |
|---|---|
| Switzerland | |
| +41 7941618 04 | Jan.Johansson@q-trem.com |
| Sweden | |
| +46 705862354 | Alar.Lange@q-trem.com |
Company info
Q-TREM OÜ
Hälli pöik 16, 13521
Tallinn, Estonia
Reg code: 12734730
VAT code: EE102249264
Schedule a live demo
Reach out to us!
Experience a case for a global enterprise with one of our experts covering the following:
- Automate your upload. Follow your liquidity
- Run & compare multiple scenario forecasts
- Combining cash forecasting with FX reporting
- See immediate effect of What-if ?
- Build & visualize your own KPIs, charts